General Overview
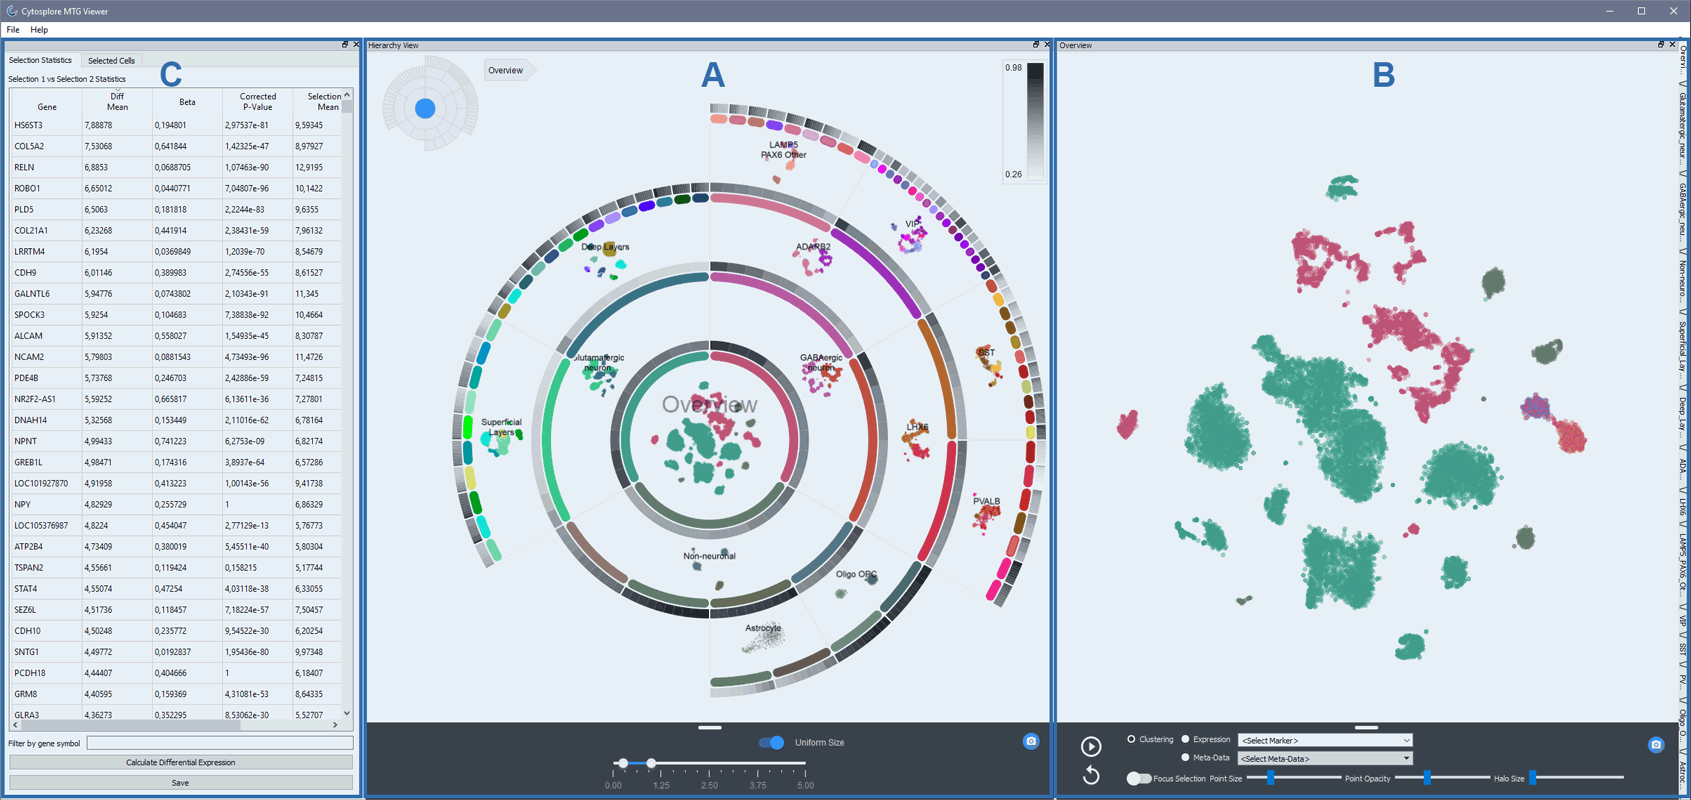
The graphical user interface of Cytosplore Viewer consists of three main components: A The Hierarchy Viewer, B The Map Viewer and C The Differential Expression Viewer.

A - The Hierarchy Viewer is designed to view a cellular hierarchy of tSNE maps, enabling navigation through submaps in the hierarchy. All tSNE maps are ordered in a ring configuration, and the outer ring segments are the leafs of the tree. The left-top pictogram provides a trail of the map that is being viewed. All maps have been computed using pre-computed gene presets for each submap: i.e. each map is constructed from a different gene set. Maps are pre-loaded upon startup, but can all be dynamically recomputed using the fixed gene presets and inspected. The colored rings represent different cluster aggregations of nuclei throughout the hierarchy. The gray ring panels represent the most distinctive genes expressed within a cluster, compared to the other clusters in the submap. These ring panels are sorted on cluster localization of expression (Beta). The genes accessible through the rings are drawn from the reduced gene presets that were used to construct the maps.
B - The Map Viewer is designed to view metadata of each cell on each submap, to manually select sets of cells for differential gene expression analysis, and to display expression of single genes. Gene expression display and differential analysis is performed on the full gene set (in contrast to the gene subsets used to create the tSNE maps). Nuclei can be selected from pre-specified clusters, or by manual drawing.
C - The Differential Expression Viewer is designed to analyze differential expression between different subselections of nuclei. One selection of nuclei can be contrasted against all other nuclei, or against a secondary selection. A number of differential expression statistics between selections are computed, and genes can be sorted for all these traits. This enables mining the full feature set based on differential features between selections, and all analysis results can be copied to clipboard for export.


