The Hierarchy Viewer
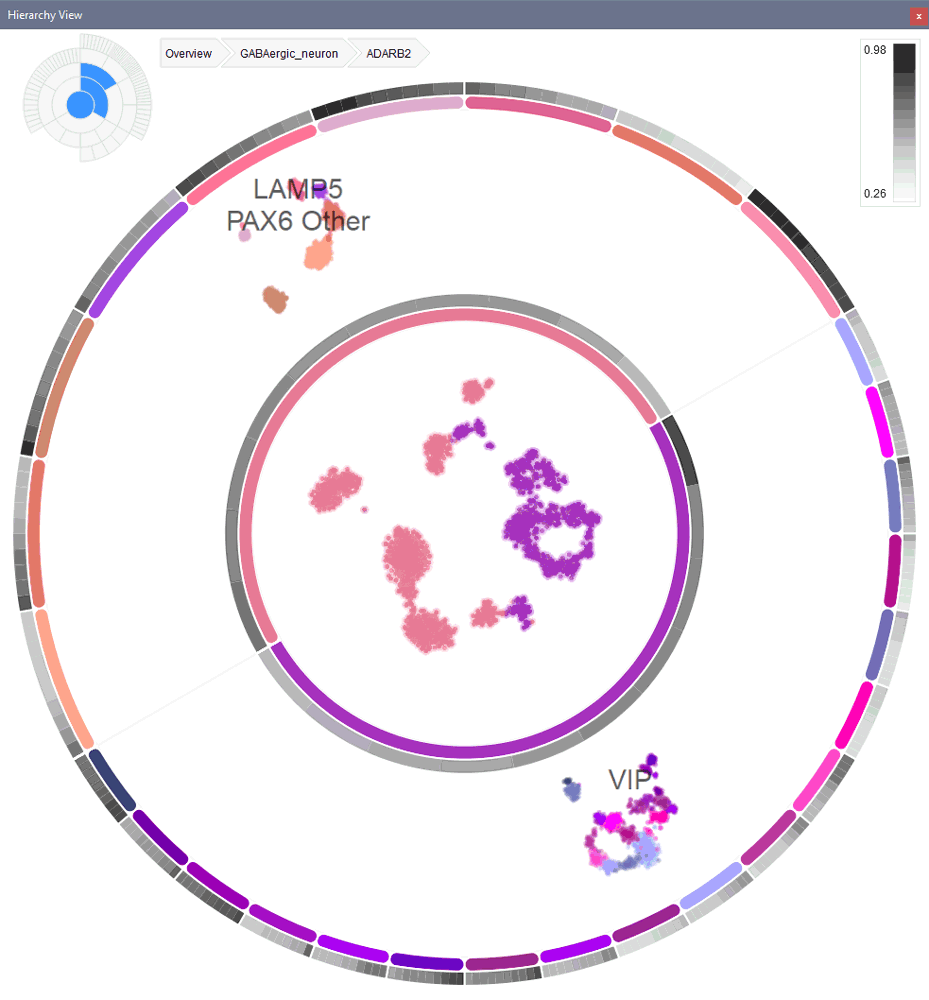
The hierarchy viewer shows the cell hierarchy in an integrated view and is linked to the Map Viewer. The color panels along the ring represent pre-specified clusters of cells, based on the AIBS clustering and color convention. Hovering over the ring segments shows the cluster name, and clicking on the segment selects the cells in the cluster. The gray panels enable a quick exploration of genes with localized expression in the corresponding cluster. The panels are sorted by locality score Beta, and clicking on a gray panel activates the corresponding submap colored by the expression of that particular gene. Note that the genes in the ring are drawn from the gene subsets that were used to compute the submap. Exploration of the full feature set is possible from the Differential Expression Viewer.
Clicking on a submap in the Hierarchy Viewer activates the submap in the Map Viewer. Upon zooming in on a submap with shift-left click, the submap of interest will be opened in the center of the ring, with its children in the outer rings. This gives individual clusters in the submap more space along the ring and an easier inspection of the cluster specific gene expression in the gray panels.

In the top-left, there are two navigation aids that show where the current map is situated in the hierarchy:

A Pictogram of the full hierarchy wheel. In blue the current zoom trace is displayed from the overview map to the currently active sub map in the center of the ring. Left-clicking in the small gray panels in the wheel pictogram will zoom into the segment of interest.
B Breadcrumb trace that displays the trace to the overview map (root node of the hierarchy), and the names of the submaps along the trace. Clicking on the trace arrows opens to the corresponding submap.
Both these tools can be used to zoom out to the overview level as well.


