The Differential Expression Viewer
The Differential Expression Viewer is designed to mine the full feature set for differential expression between two selections of cells.
There are three methods to select cells / nuclei:
-
Manual drawing of cell selections in the Map Viewer (Left-click and drag).
-
Clicking on a colored ring segment in the Hierarchy Viewer selects the cells in that cluster / preset.
-
Using the metadata legend in the Map Viewer: clicking on a metadata item in the legend selects the corresponding cells.
Selections can be emptied by left-clicking in an empty space in the map viewer. By default selections are stored in selection 1. Pressing the left-alt key while performing these actions will fill selection 2.

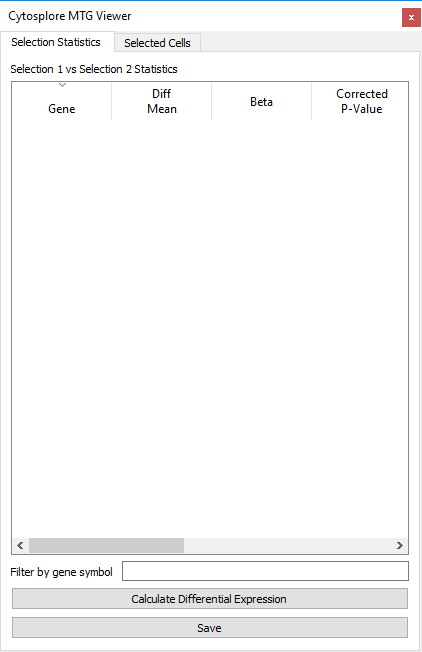
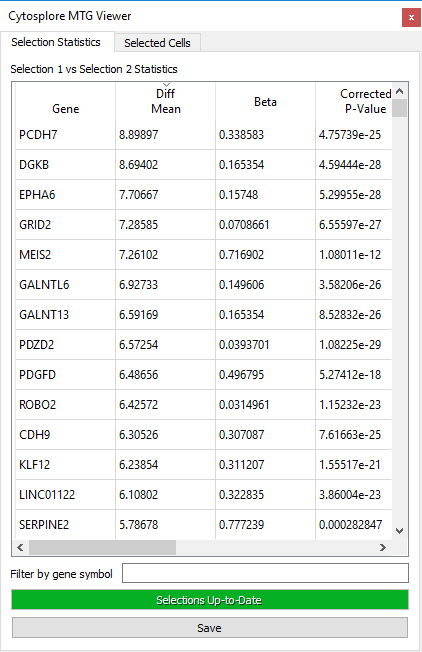
Once the selections are set, clicking the Compute Differential Expression button will compute differential expression statistics over the full feature set and will fill the table.

The default behavior for the differential expression viewer is as follows:
- Differential expression and Beta are only computed if a gene is expressed in at least 5 cells in each selection, and otherwise set to 0.
- P-values for differential expression are computed if a gene is expressed in at least 10 cells in each selection using the Wilcoxon rank-sum test, or otherwise set to 1.
- P-values are corrected for multiple testing through Bonferroni correction.
- Compute times may increase with larger selections.
Once the differential expression computation has finished, the analysis results can be explored as follows:
- Gene expression coloring in the map view can be performed by clicking on a gene name in the left column. This will display the expression of the selected gene in the Map View
- Gene sorting can be performed by left-clicking on the sorting variable names at the top of each column. Left clicking again will sort the variable in reverse order. The columns can be reordered by clicking on the column name, and dragging it to a new position in the table.
- Gene filtering can be performed to reduce the number of listed genes by typing gene symbol characters in the “Filter by gene symbol” field.
- Cell selections can be inspected, loaded from file or saved through a separate tab “Selected Cells”.
- Result export can be achieved through the clipboard by right-clicking on the result table, or by pressing the “save” button.

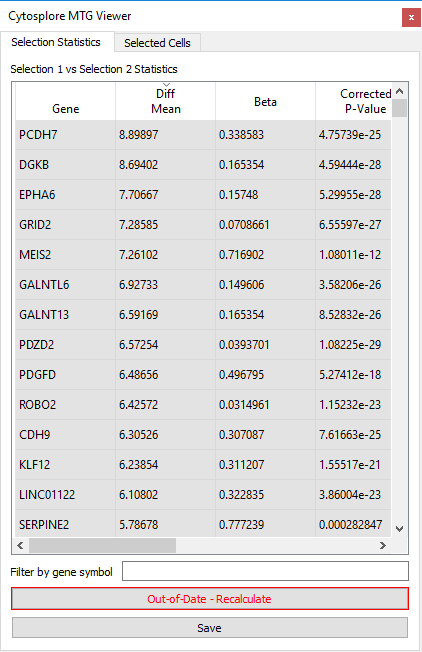
If either of the selections is changed, the results in the table will no longer be up-todate with the selections: this is indicated in the differential expression viewer by a darker background color for the statistics table and the button “Out-of-Date – Recalculate” will become visible. Note that the previously calculated differential expression results can still be interactively explored.


