Evo Viewer
Welcome to the Cytosplore EvoViewer tutorial! Follow the structured steps below to unlock the full potential of EvoViewer.
This tutorial requires the Cytosplore Viewer installer which can be downloaded from here.
Tutorial Sections
Exploring cell types
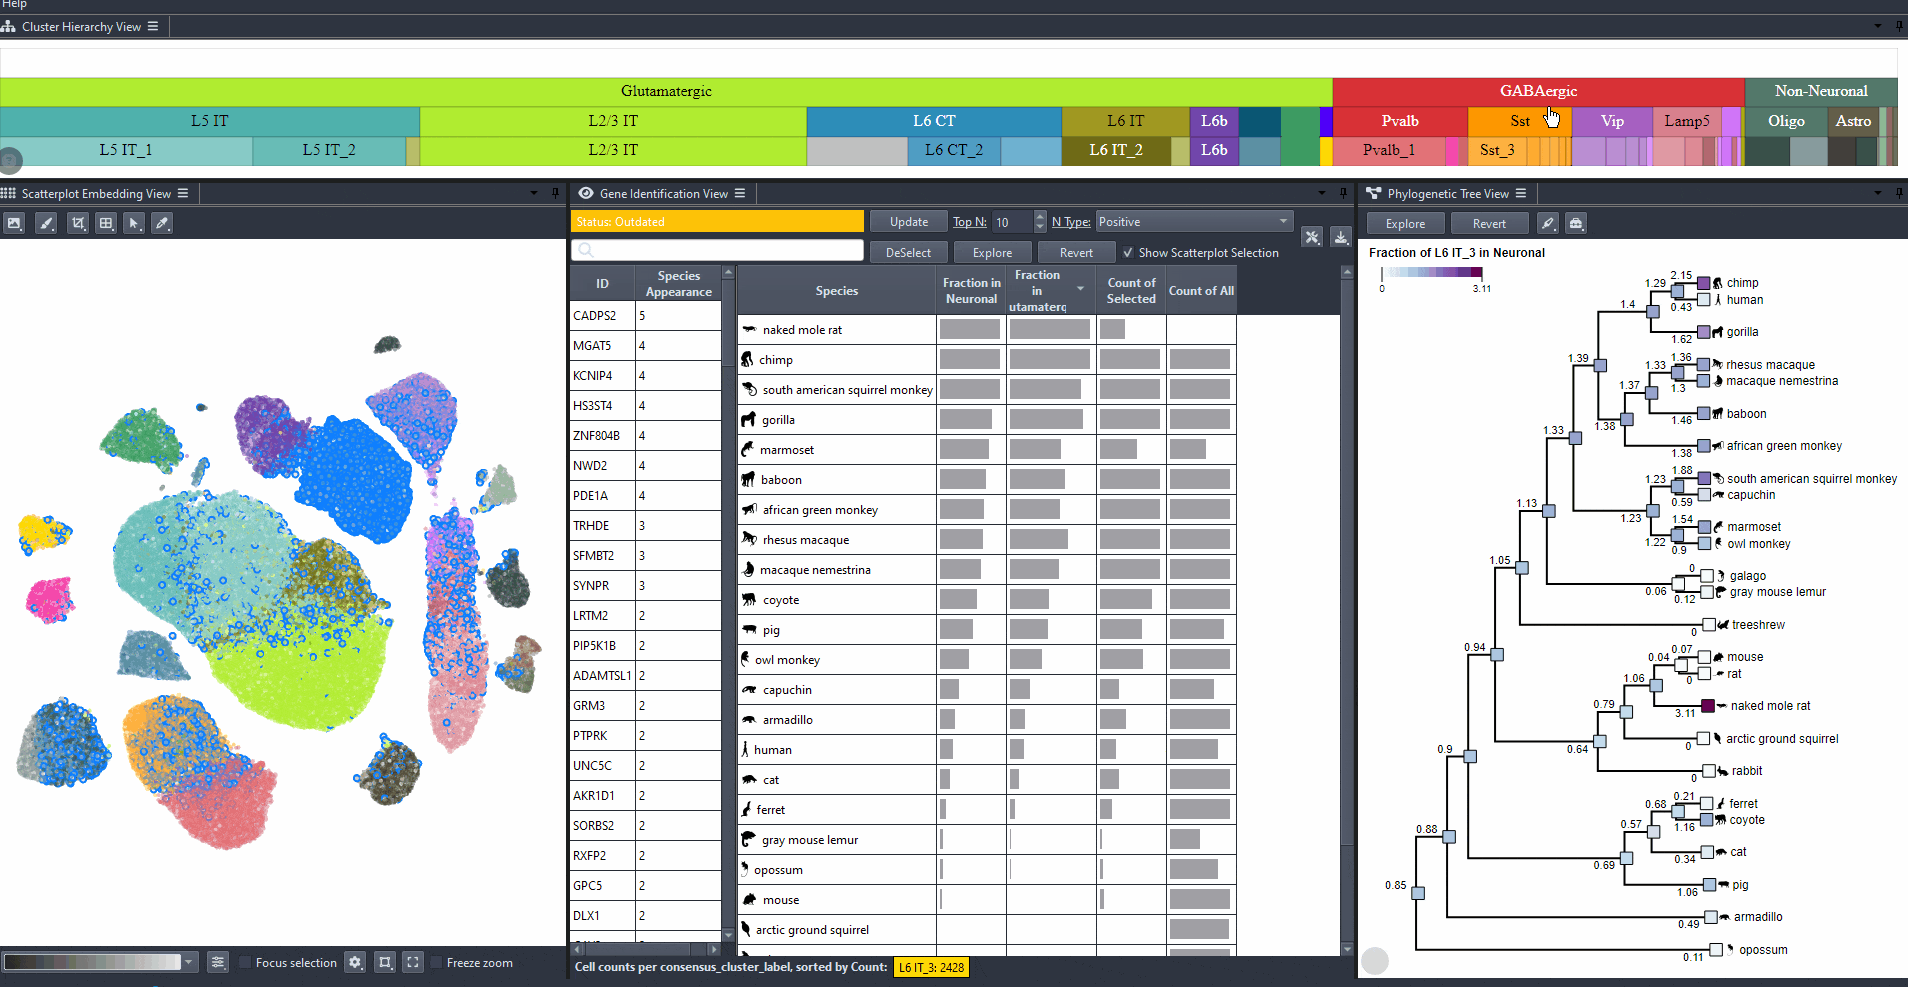
To start exploring the dataset, cells can be selected and analyzed at different levels of the taxonomy.
Click on the cell type rectangles in the cell type hierarchy to select a cell type.
Press shift and click on the cell type rectangles in the cell type hierarchy to select multiple cell types.
The selected cells will be highlighted in the scatterplot.
Press shift and click on the cell type rectangles in the cell type hierarchy to select multiple cell types.
The selected cells will be highlighted in the scatterplot.
Watch how to select cells from the hierarchy

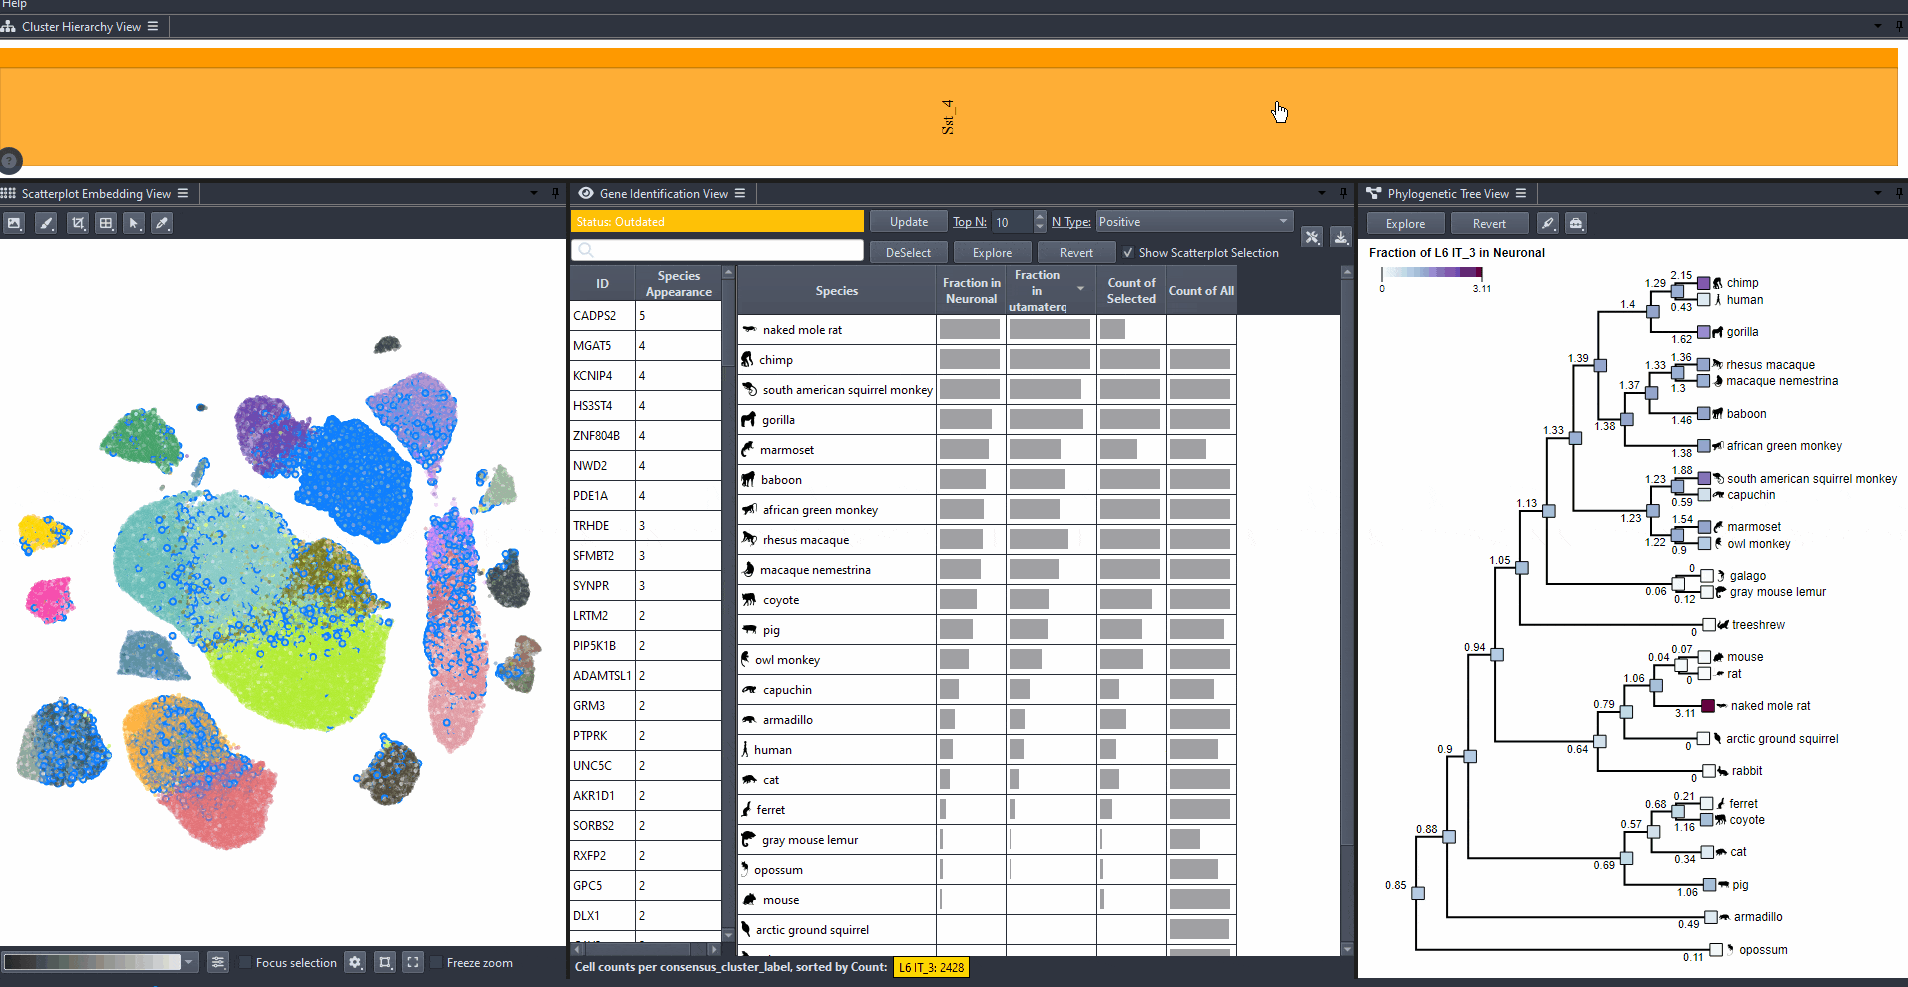
Press Ctrl and click on a cell type rectangle to zoom in.
Watch how to zoom in
Press Ctrl and click on a parent cell type rectangle to zoom out.
Watch how to zoom out
Cells can also be selected from the scatterplot.
Click on in the scatterplot options to access the selection settings.
Click on in the scatterplot options to access the selection settings.
Watch how to make free-form selections

Analyzing Gene and cell type characteristics
Analyze the characteristics of genes and cell types to gain deeper insights into the dataset.
Click on to compute the cell and gene type characteristics of the selected cells.
Watch how to compute characteristics

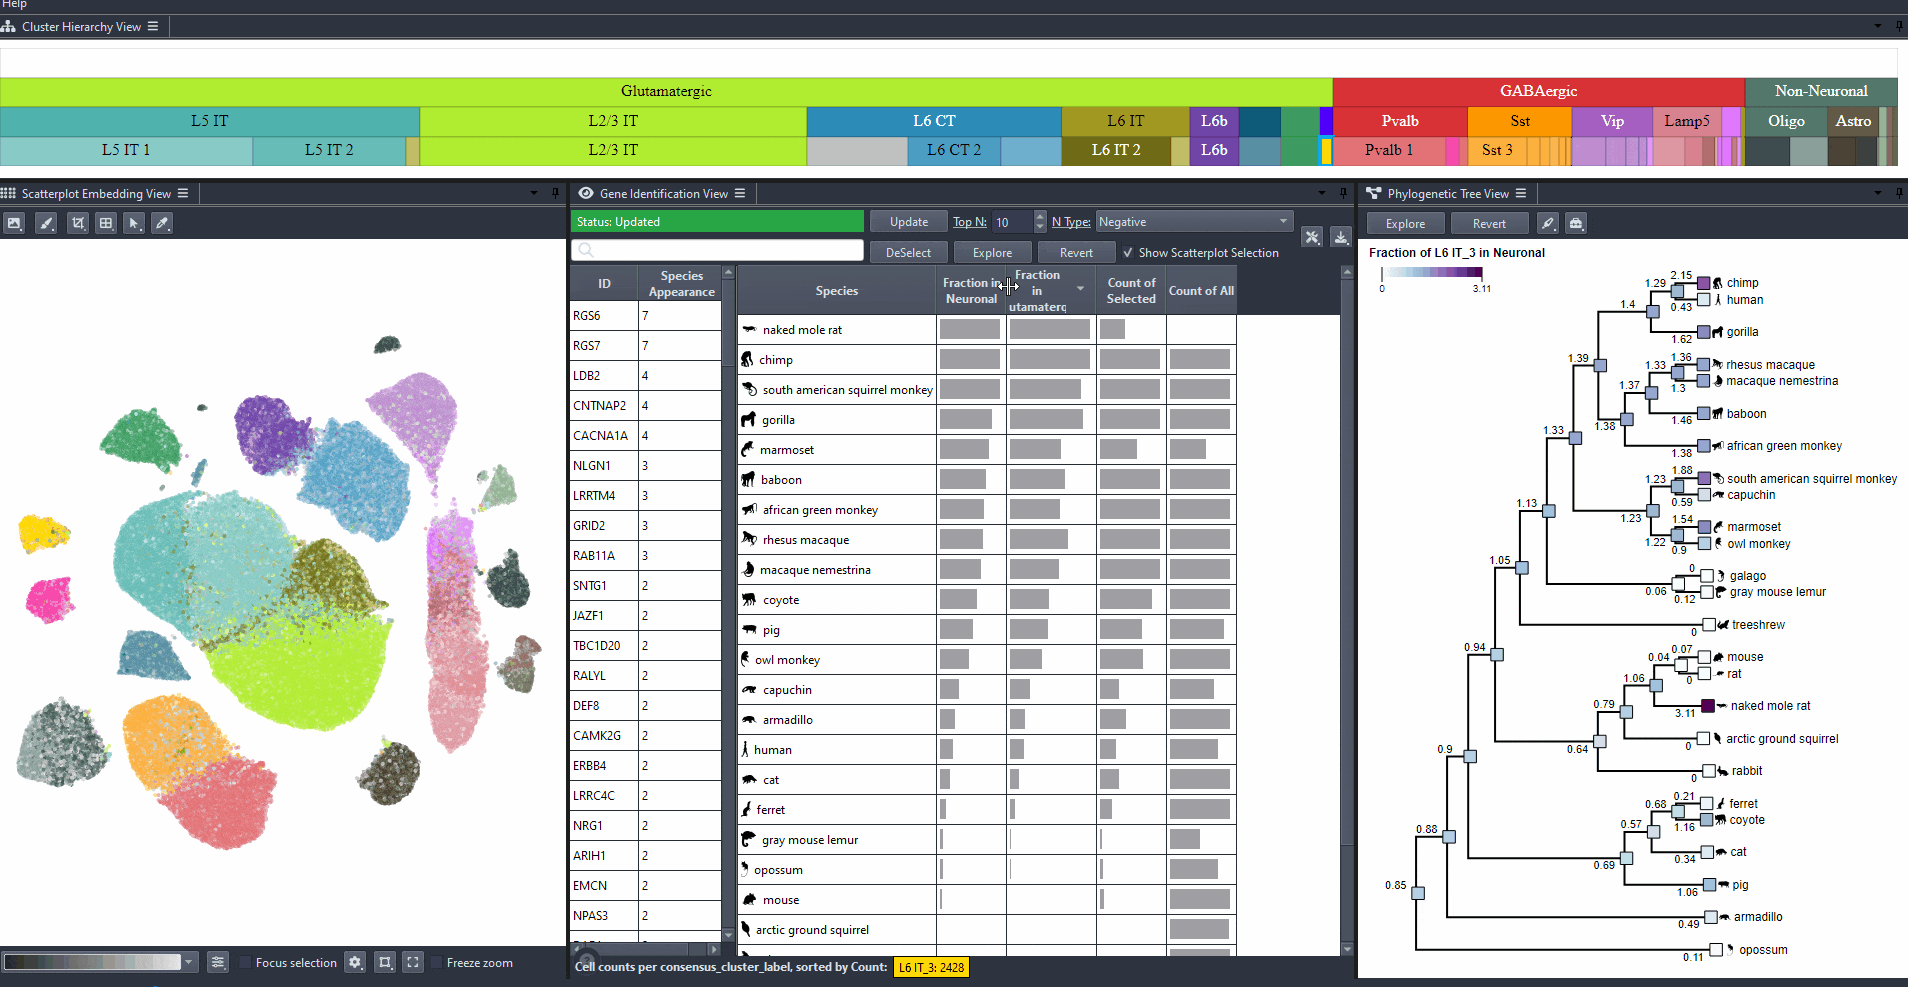
Modify to change the type of differential expression calculation.
Options include: (mean expression in selected cells minus non-selected cells), (the same value but negated), and (the absolute value of the difference).
Click on and toggle to get differential expression values on a log scale.
Watch how to modify options

Comparing cell abundance across species
Compare the abundance of cell types across species.
Species can be sorted by abundance in the table view by clicking on the table headers.
Abundance options include: (Count of selected and Count of all cells per species), and (Computed relative to a parent cell type, e.g., Neuronal, GABAergic, or Glutamatergic).
Watch how to sort species
Expand the table columns or hover over each cell to see the numerical values.
Watch how to explore table values

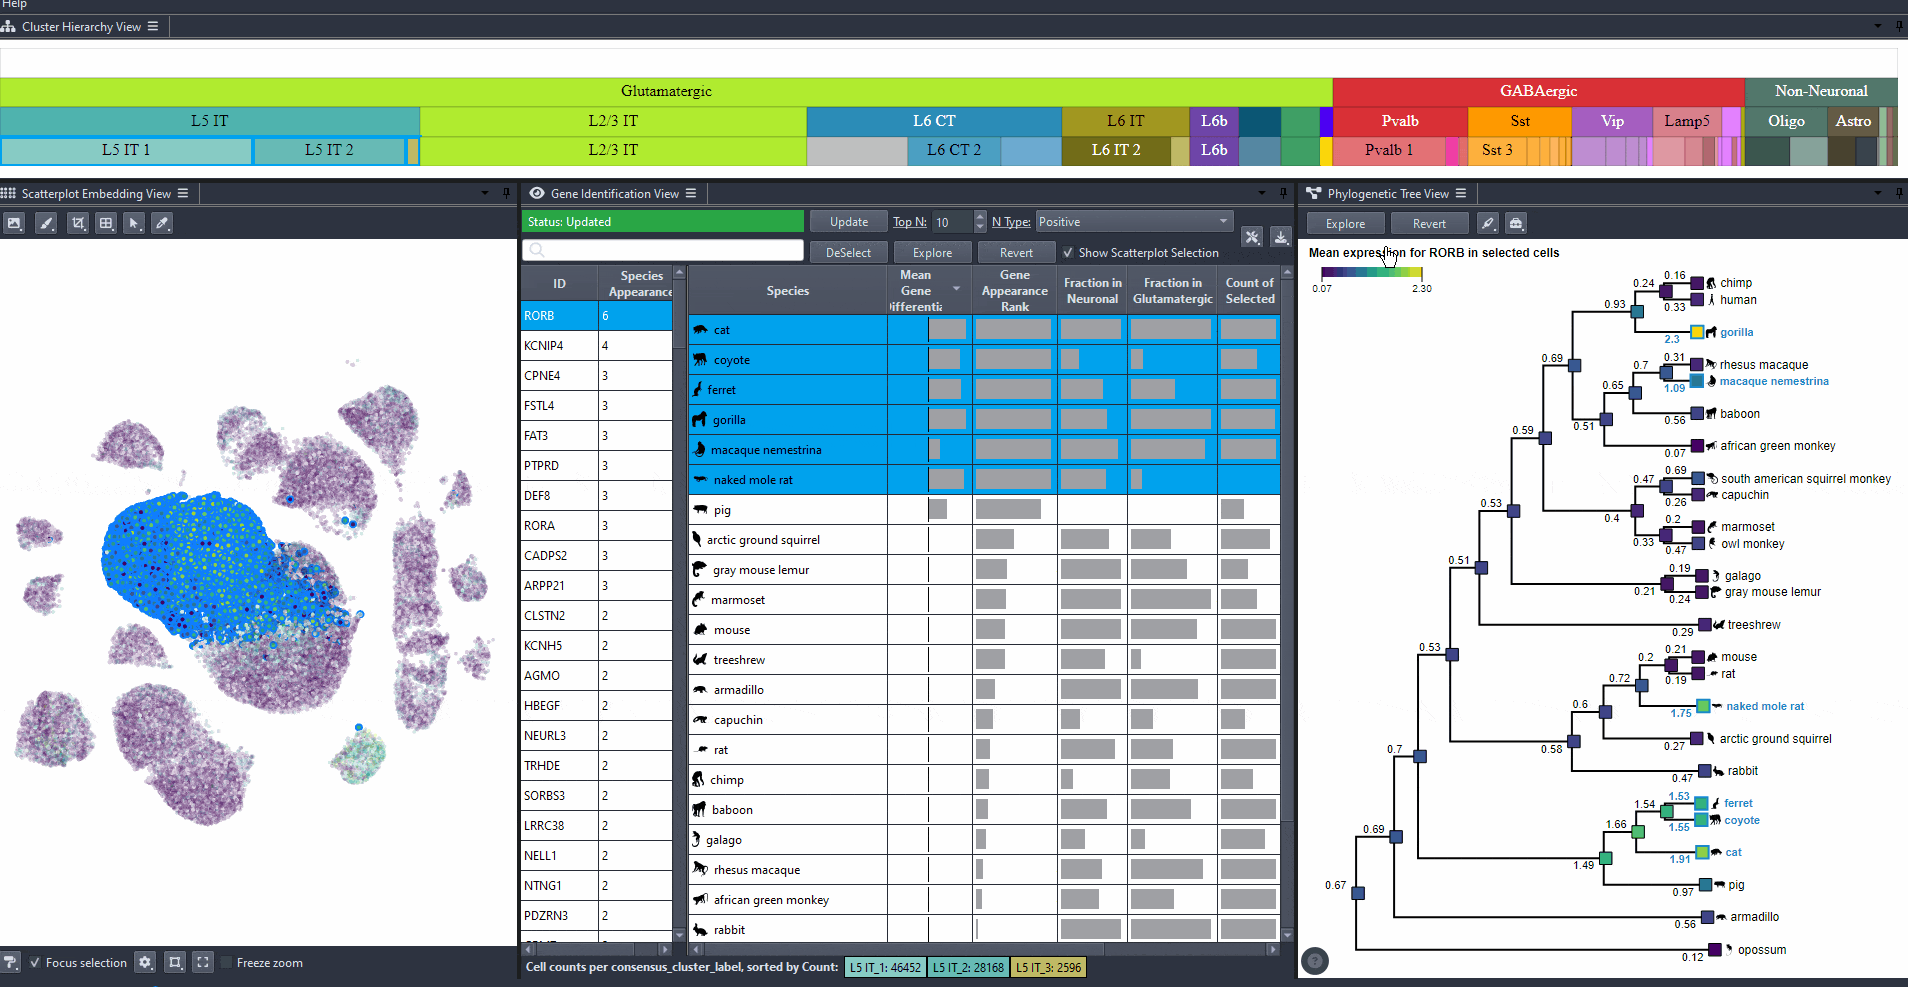
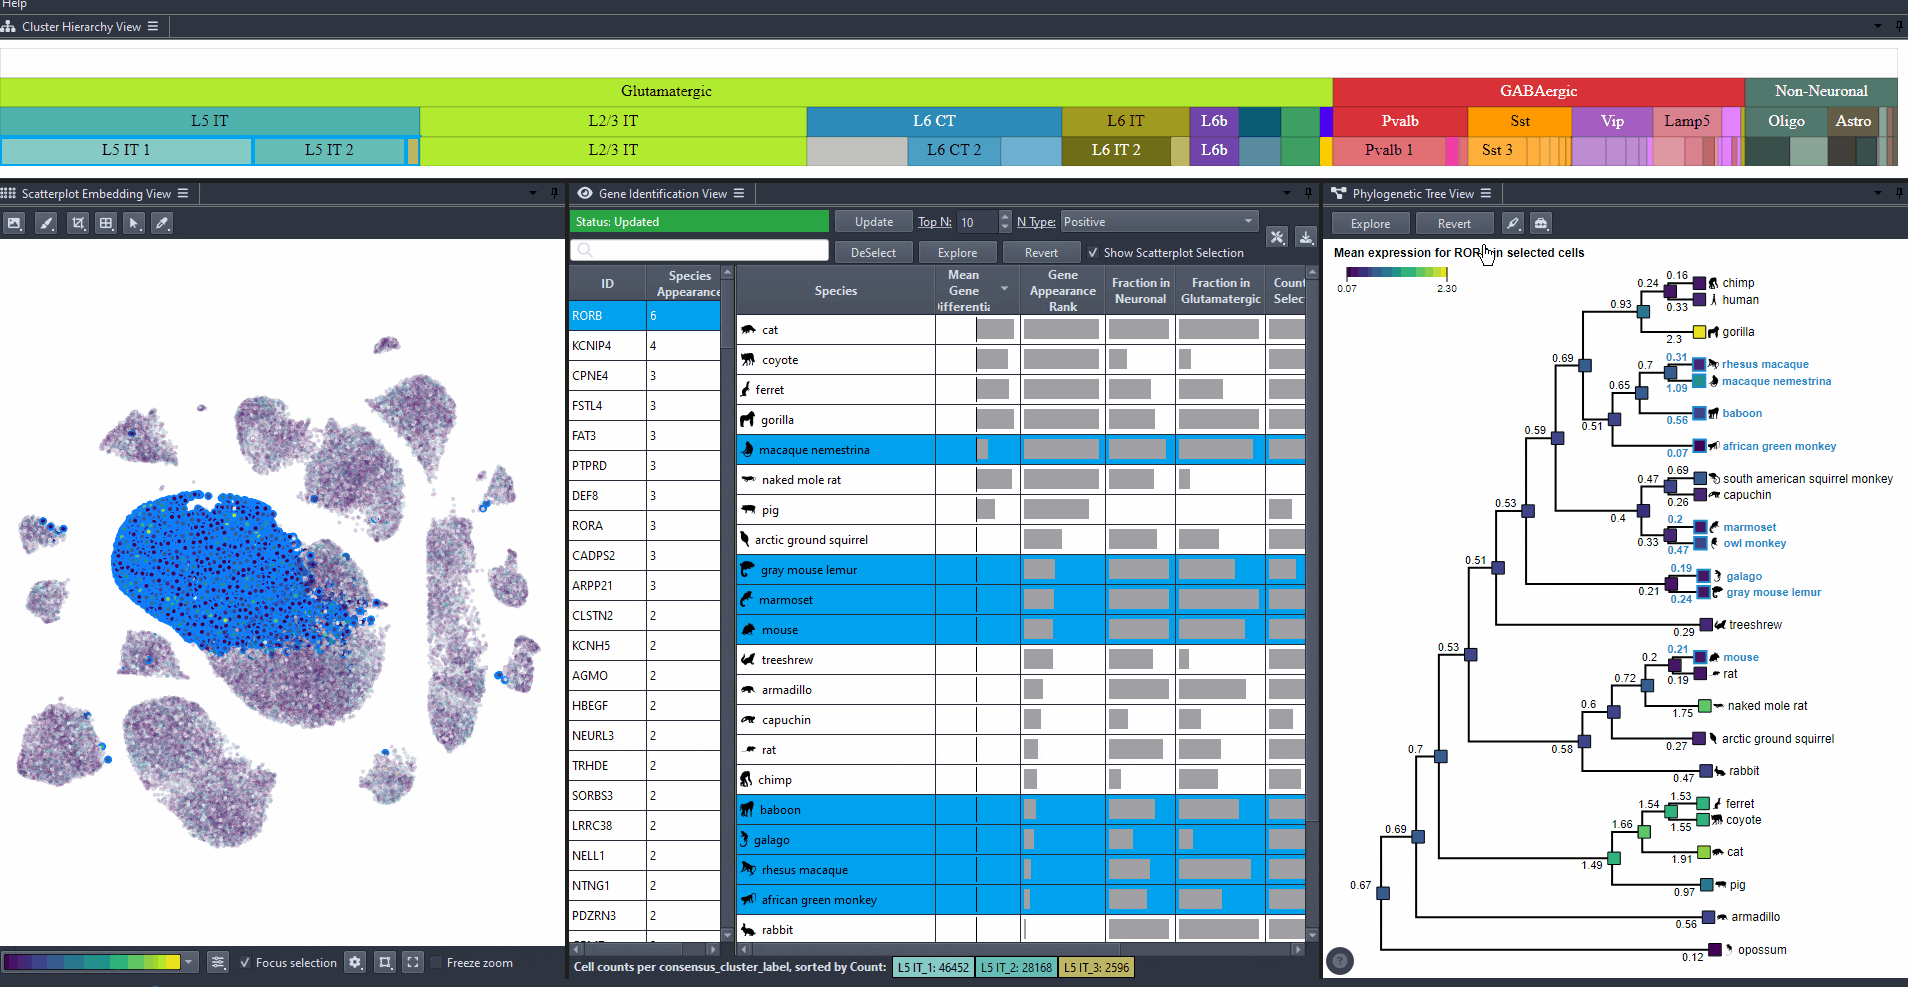
Identifying interesting genes
Identify genes with high differential expression for a specific cell type (marker genes) in one or more species.
Click on the table header to sort genes by the number of species they are most relevant to based on the ranking threshold.
Watch how to sort genes
Edit the field to automatically update the ranking threshold.
Watch how to modify thresholds

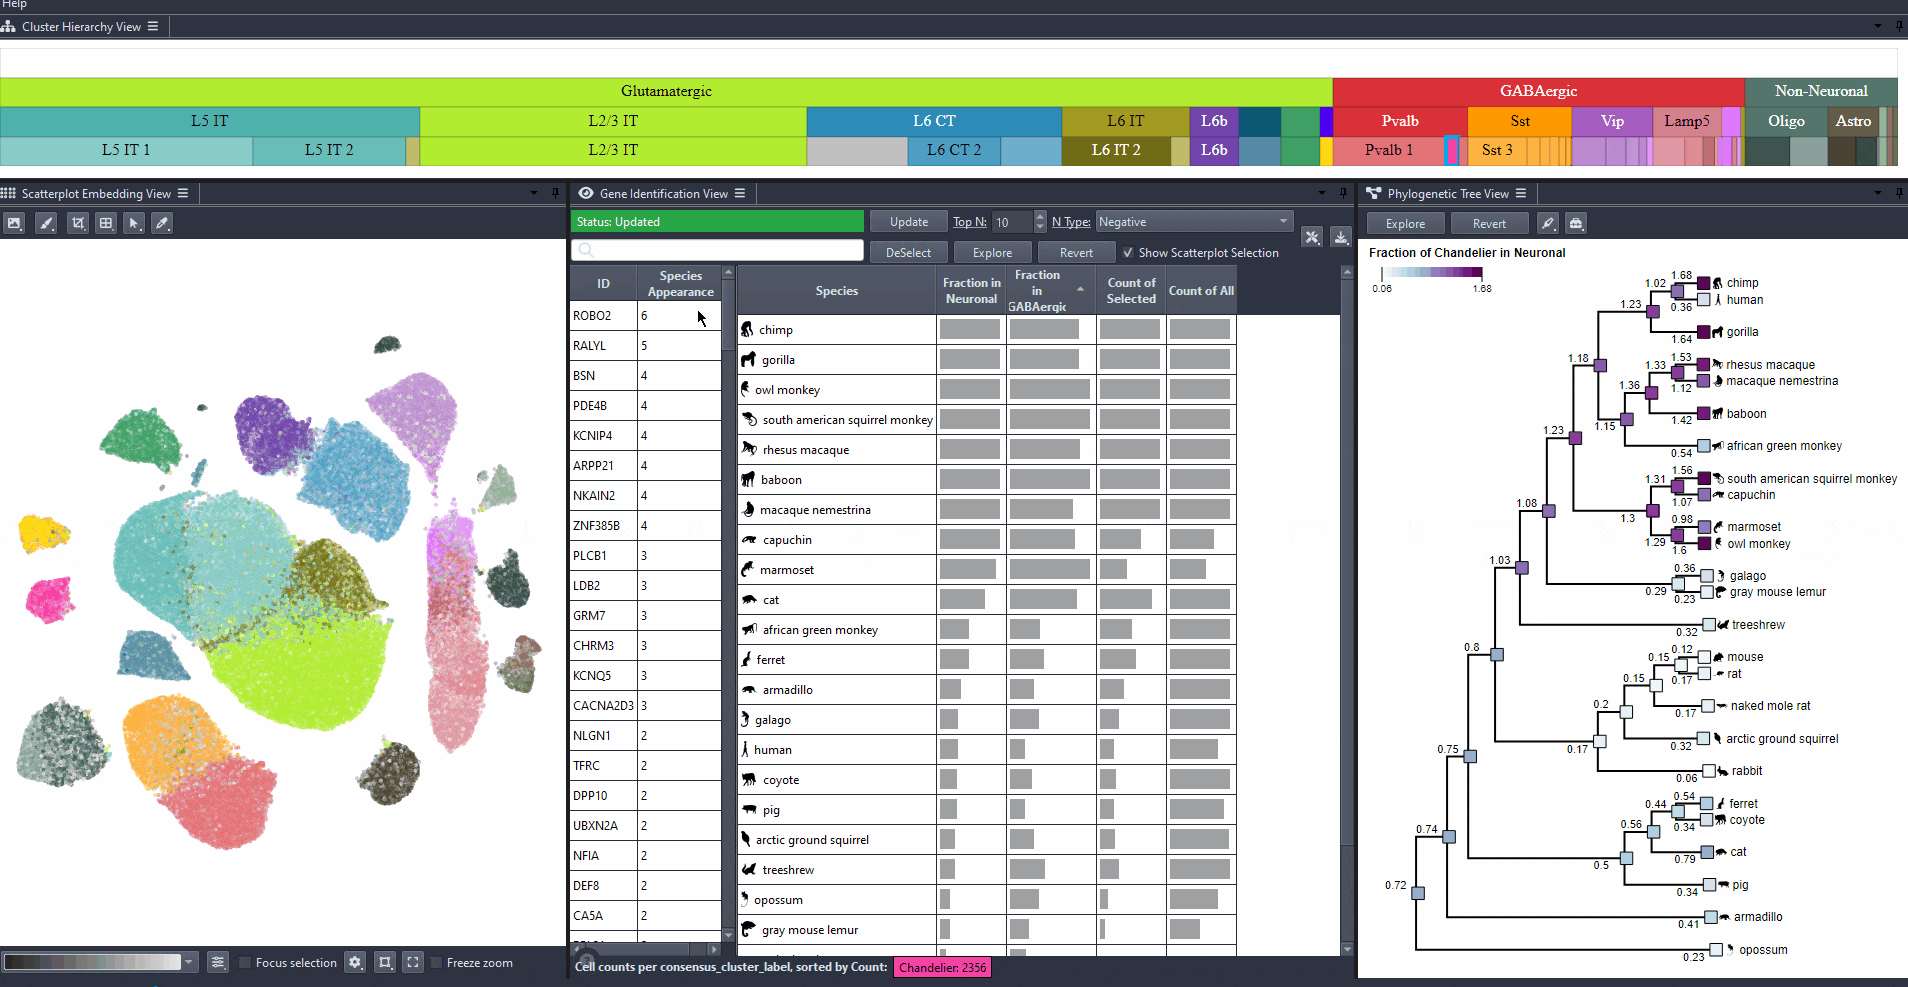
Explore gene relevance across species
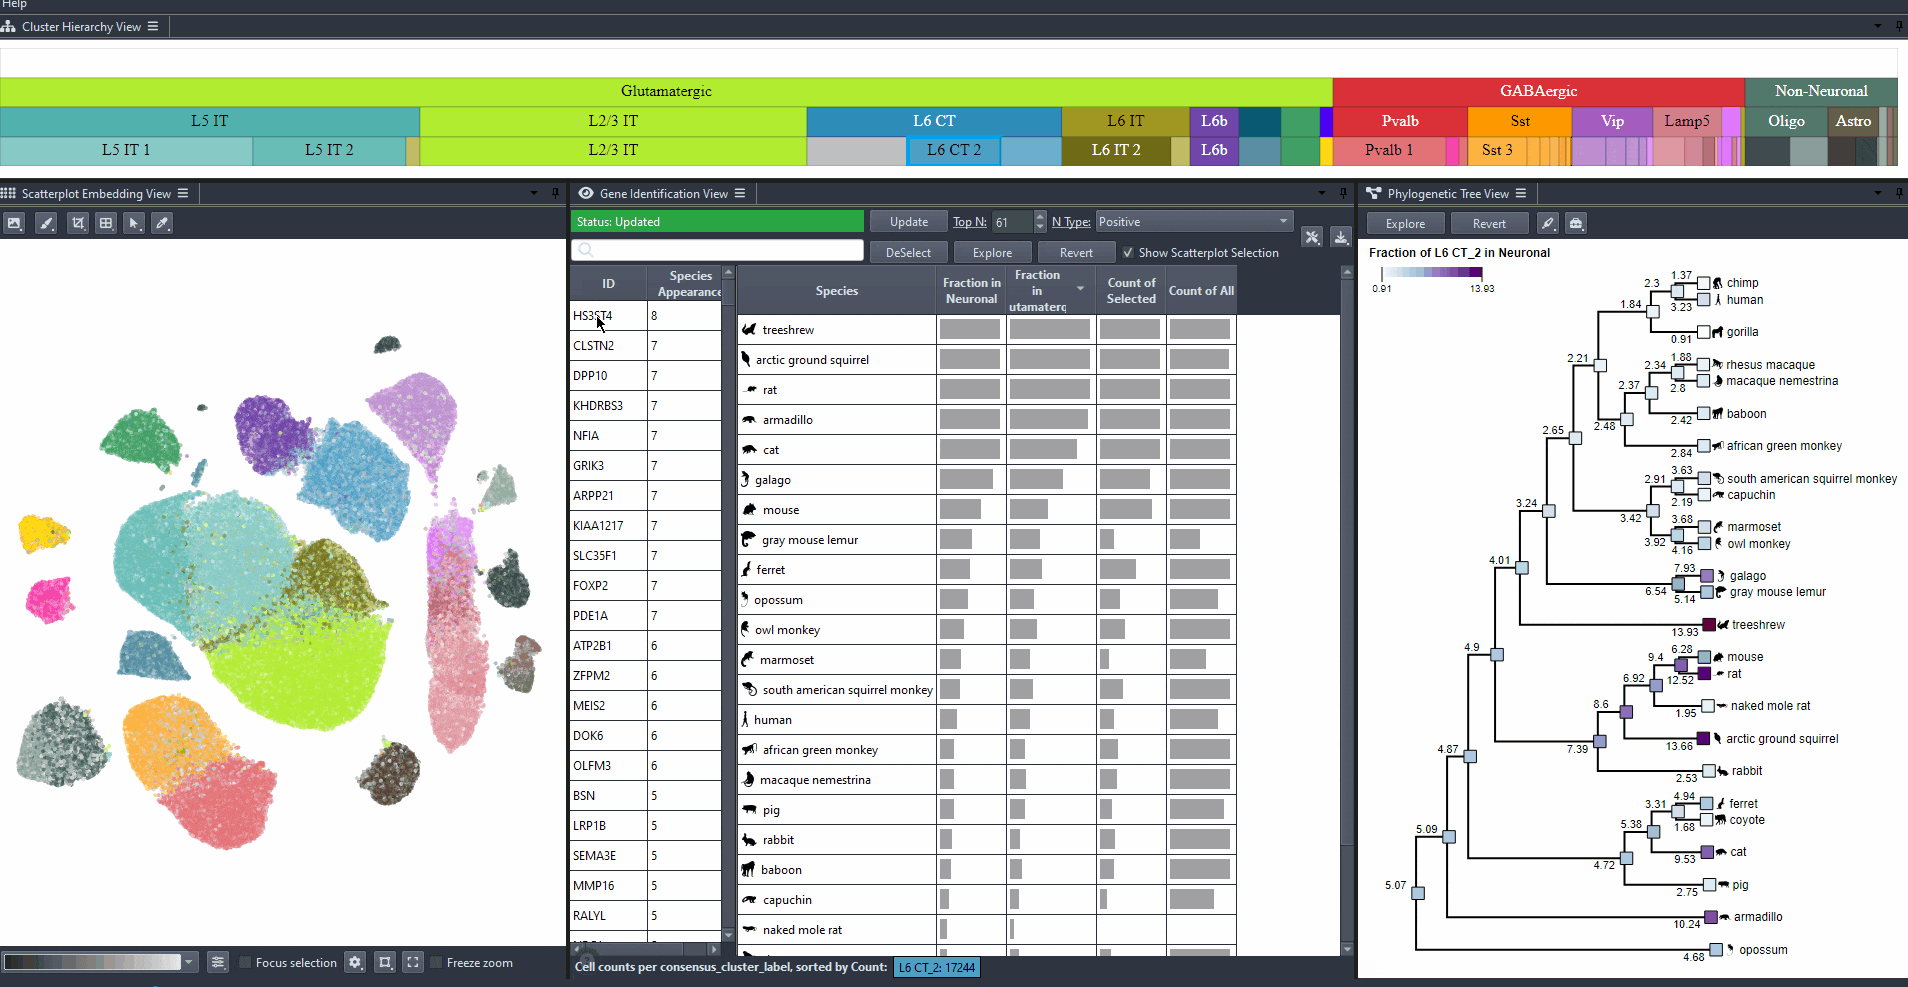
For identified genes, explore their relevance for the same cell type in other species.
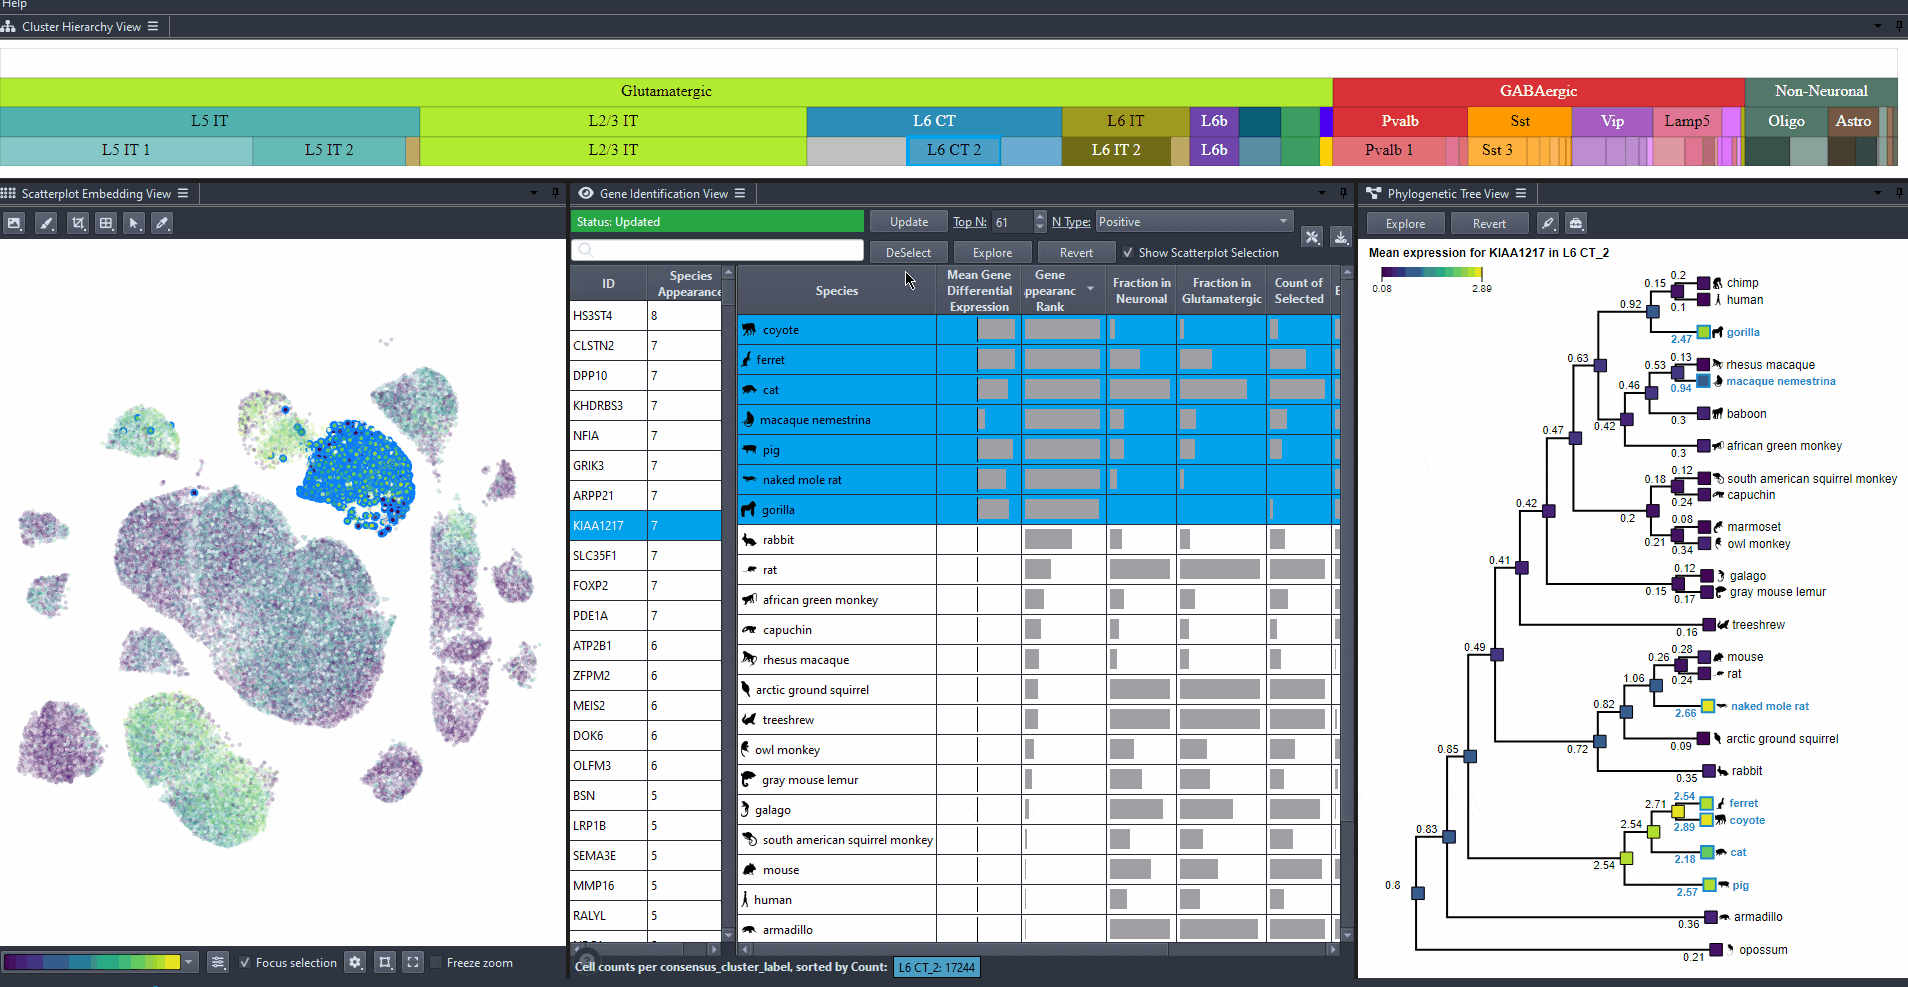
Click on a gene in the left table view to select a gene
The Scatterplot, Right table, and phylogenetic tree views gets updated based on the selection.
The Scatterplot, Right table, and phylogenetic tree views gets updated based on the selection.
The table on the right displays the species for which the gene is most relevant.
The scatterplot shows all cells of the selected species, colored by the expression of the selected gene.
The phylogenetic tree is colored based on attribute values such as mean expression, mean differential expression, appearance rank, or abundance.
Watch how to select a gene for exploration
Watch how to deselect
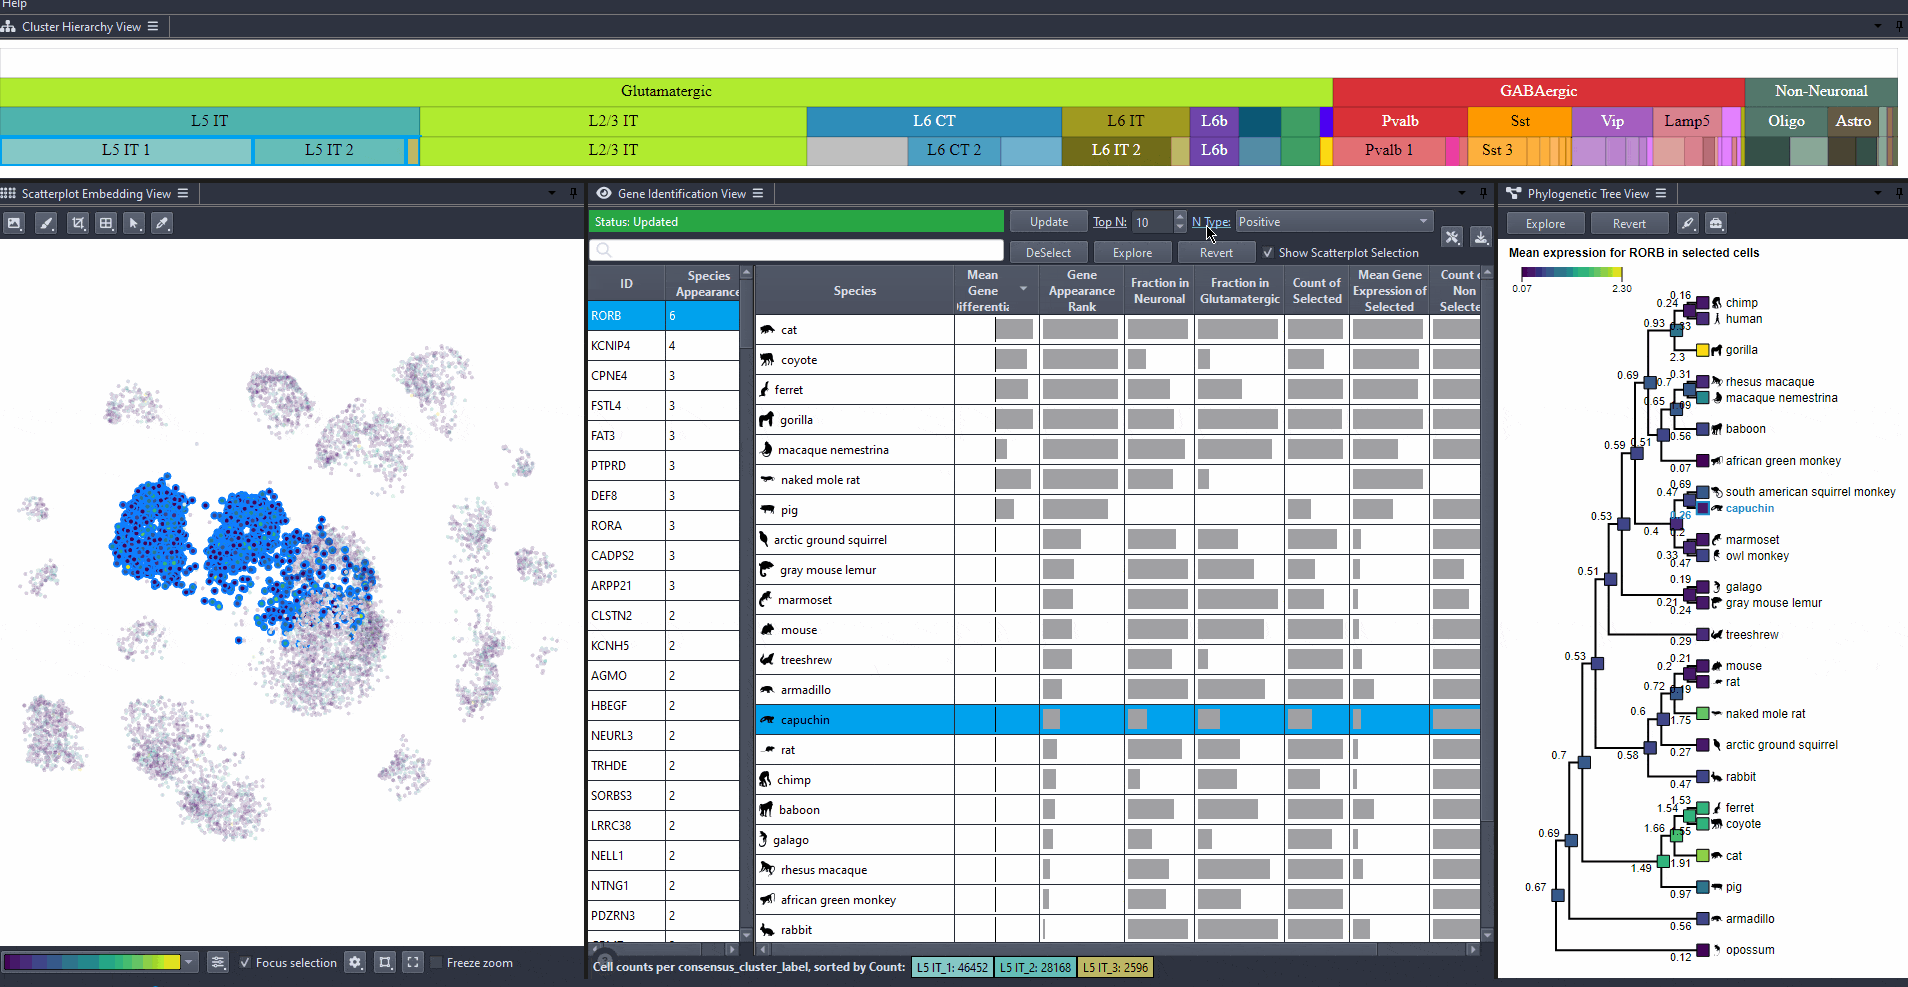
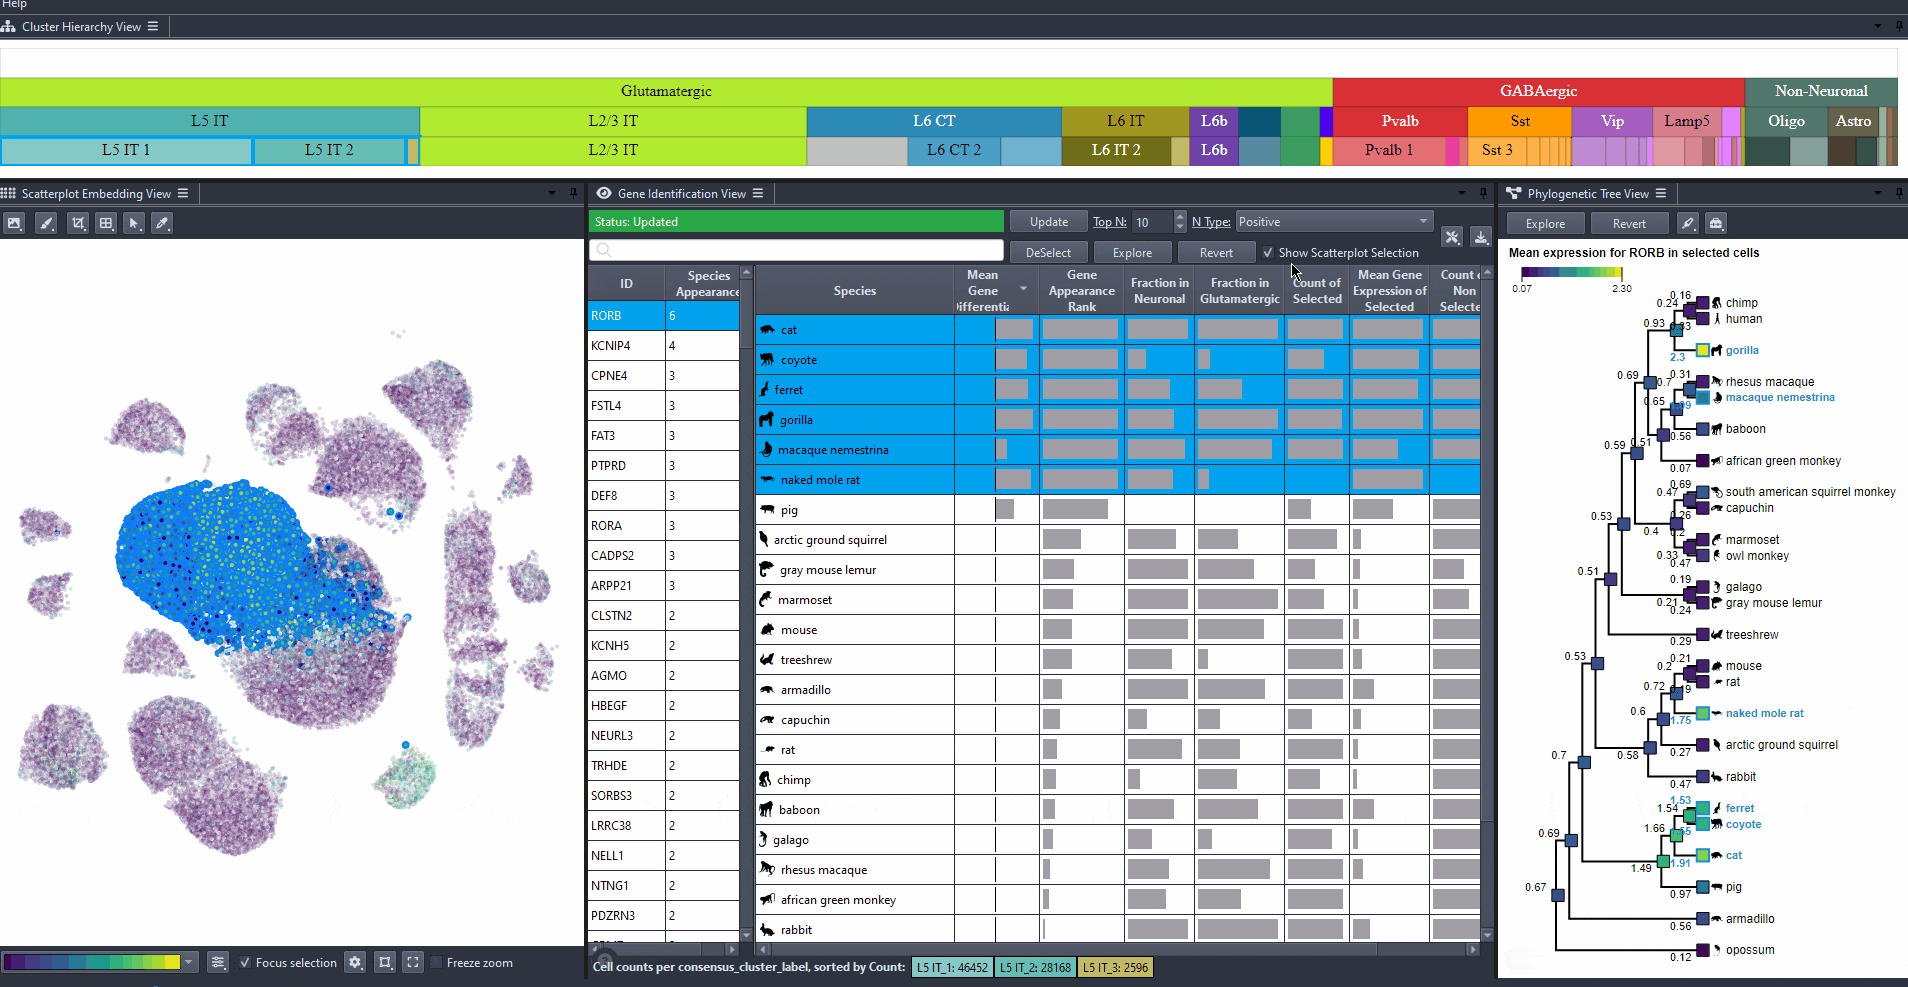
Sort attribute values such as mean expression, mean differential expression, appearance rank, and abundance for exploration. Expand columns to view the full numerical values, also hover over table cells to reveals these values.
Watch how to explore table attributes

Click on a species in the right table view to explore the expression patterns of it's cells in the scatterplot colored by the gene's expression.
Watch how to explore missed species

Watch how to revert selection
Toggle scatterplot selection from the checkbox .
Watch how to toggle scatterplot selection
Compare species by prior knowledge
Compare species according to prior knowledge, such as traits or phylogeny according to differences in marker gene properties by switching between the table attributes.
Click on the top left text or color map in the tree view to switch between attributes.
Watch how to switch between attributes in the tree
Click on nodes in the tree to select species.
Press shift and click on nodes in the tree to make multiple selections.
Click on to view the expression patterns of the selected species in the scatterplot.
Press shift and click on nodes in the tree to make multiple selections.
Click on to view the expression patterns of the selected species in the scatterplot.
Watch how to explore expression of selected species

Click on to revert to initial selection.
Watch how to revert tree selection to initial
Exporting results
Save your analysis results for future use. Exporting Table Data
Click on the icon in the table view.
Click on the button to save species details as csv.
Click on the button to save gene details as csv.
Click on the button to save species details as csv.
Click on the button to save gene details as csv.
Watch how to save table data

Click on the icon in the phylogenetic tree view.
Click on the button to save phylogenetic tree details as json.
Click on the button to save phylogenetic tree details as json.
Watch how to save tree data